
BUSINESS
Gold Price Falls to a Seven-Week Low on Hike Bets
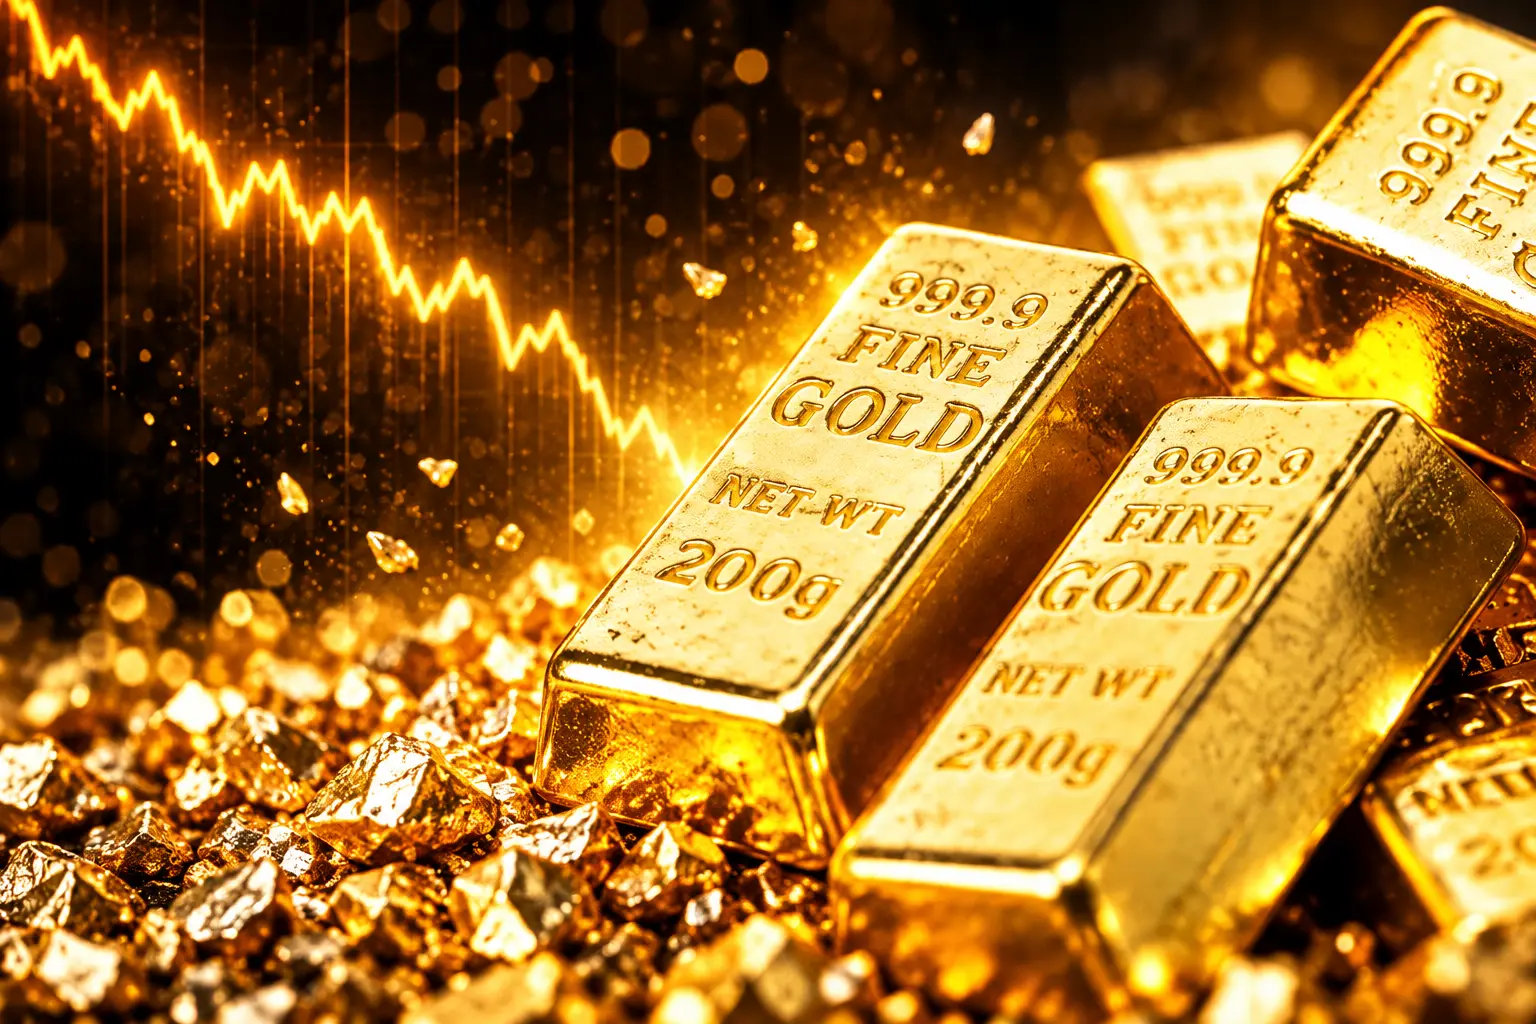
Gold fell 2.35% to $4,184 as Hormuz oil and hawkish Fed talk turned an inflation shock into a rate scare that sold bullion.

Gold fell to $4,184.33 an ounce on Monday, a 2.35% drop and a seven-week low.
Oil stayed high after President Donald Trump rejected an Iranian offer to reopen the Strait of Hormuz, and traders rebuilt bets on another Federal Reserve rate increase.
Gold’s Hedge Bid Runs Into the Rate Machine
Bullion is the asset people buy when prices run hot and when a war threatens supply. Both of those conditions are in force, and the metal still sold off. The channel that is winning is interest rates: hotter oil feeds inflation, inflation feeds hike odds, hike odds lift the dollar and Treasury yields, and gold, which pays no coupon, gets cheaper to dump.
Trading Economics put the Monday print $100.67 below Friday’s $4,285 reference, a 2.35% decline that also leaves the metal 5.78% lower on the month even though it is still 9.16% above its level a year ago. Spot had closed at $4,284.97 on Friday, September 25, per GoldPrice.com, after a weak week. The January 29 closing high of $5,405 is a long way above this tape, but that gap did not stop the latest selling.
Kelvin Wong, senior market analyst at OANDA, put the hierarchy in one line. “Focus will definitely continue to be on the interest rate situation. When we start to see markets pricing in a much more hawkish Fed, it strengthens the dollar and is negative for gold,” he said.
Cleveland Fed President Beth Hammack, a 2026 voter, gave the policy side of that trade on Friday.
The biggest risk that I see with inflation right now is that an inflationary mindset could start to set in
Beth Hammack, Cleveland Fed president, September 25 panel at her bank
She added that policy needs to be “at a restrictive stance to help bring things back down to target,” and she said she does not see the current setting restraining business investment outside housing. That is a hawkish complaint, not a pause. For gold it means the inflation scare is being answered with more yield, not with more metal.
Why Higher Oil Is Sinking the Metal
Brent jumped 3.11% to $107.57 a barrel on Monday and West Texas Intermediate rose 2.19% to $94.43, on the same Trading Economics tape as the gold print. The prompt was political. Iran had floated a plan, passed through Qatari mediators at the UN, to reopen Hormuz. Trump rejected it on Saturday, then said talks could resume later in the week. Tehran said it would not soften its terms.
A closed or half-closed strait is the kind of headline that used to bid gold as a haven. This year it has done the opposite more often than not, because crude at these levels keeps US inflation sticky and keeps the Fed in play. US CPI was still 3.4% in August, well above the 2% target Hammack and her colleagues have missed for more than five years. Strategists at OCBC said gold had already slipped below $4,250, that the implied October hike probability had risen to more than 70%, and that “oil and the rates response remain the main swing factors.”
Monday followed the same path as the earlier slide tied to Hormuz fighting feeding rate-hike bets. The metal has been living with that pipe since the strait seized up: energy inflation first, then a stronger dollar, then a weaker gold bid. Safe-haven buying is still in the market. It is just smaller than the rate shock sitting on the other side of the book.
FROM THE SEPTEMBER HIKE TO MONDAY’S DROP
- September 16, 2026: The Fed raises the funds rate by a quarter point to a 3.75%-4.00% range, the first increase since 2023, in a unanimous vote.
- September 23, 2026: Governor Michael Barr says further policy adjustments are likely to be needed to get inflation under control.
- September 24-25, 2026: Hammack warns that inflation risks are tilted to the upside and that an inflationary mindset could take hold.
- September 26-27, 2026: Trump rejects Iran’s Hormuz reopen offer; oil firms again.
- September 28, 2026: Spot gold prints $4,184.33, down 2.35%, a seven-week low.
OCBC’s swing-factor list still holds after that sequence. Some easing in energy or in the dollar could steady the metal. Another leg up in yields would keep the near-term bias lower.
Four Fed Voices After the September Hike
The September move was not sold as a one-and-done. The Fed’s own projections had a 16-2 majority of officials expecting at least one more increase this year, and four participants pencilled in two. Then the regional presidents and governors went on the road and kept the door open.
THE POST-HIKE CHORUS
- Beth Hammack: The Cleveland president said output is growing at a solid pace, the labour market is close to her idea of maximum employment, and inflation has run above 2% for more than five years, with risks still to the upside.
- Michael Barr: The governor, a permanent voter, said in his base case that “further policy adjustments are likely to be needed” so inflation comes down in a timely way.
- Tom Barkin: The Richmond Fed president said the risks to inflation outweigh the risks to maximum employment, which is why the committee raised rates, and he left extra hikes as an open question.
- Susan Collins: The Boston Fed president backed the increase and wrote that a somewhat more restrictive funds rate will help inflation return to target, seeing a higher chance that prices stay “notably” above 2%.
Collins is among those pencilling in a second hike this year and expecting rates unchanged in 2027. Barkin likened inflation to a troublemaker who may need more than one talking-to. None of those remarks is a promise of an October move. Together they are why implied probabilities from fed funds futures rebuilt after the September decision, and why gold is trading the next meeting, on October 27-28, as a live risk.
The 10-Year Yield Holds Near 5.21%
The US 10-year yield held near 5.21% on Monday after a week in which it had reached its highest since 2007. The 30-year had pushed to levels last seen in 2004. The dollar index was at 101.10. Hammack said long-term yields were being lifted by stronger growth expectations, concerns over government debt, and bets on more rate increases. That mix is poison for a non-yielding asset priced in dollars.
MONDAY MARKET SNAPSHOT
| Market | Level | Day move |
|---|---|---|
| Gold | $4,184.33 | -2.35% |
| Silver | $61.69 | -4.00% |
| Brent crude | $107.57 | +3.11% |
| WTI crude | $94.43 | +2.19% |
| US dollar index | 101.10 | +0.06% |
| US 10-year yield | 5.21% | higher on the session |
Silver’s 4% drop was the sharper metals hit, the usual pattern when real yields jump and traders cut the whole precious-metals book. The dollar’s Monday gain was small on that snapshot, which is a reminder that gold did not need a dollar spike to fall. It needed oil and yields pointing the same way.
Poland and China Kept Adding to Reserves
The people who do not mark gold to a morning yield screen kept buying into the spring, which is the other half of this tape. The World Gold Council’s Q2 demand report, released July 30, said central banks and other official institutions added 289 tonnes of gold in Q2, up 62% from 177.9 tonnes a year earlier and a record for a second quarter. That was a fivefold jump from a revised 57 tonnes in Q1. First-half official demand was still 345 tonnes, the lowest H1 since 2022, after heavy Q1 sales by Turkey, Russia and Azerbaijan.
WHO BOUGHT IN THE SECOND QUARTER
- Poland: The National Bank of Poland added 51 tonnes, taking reserves to 632 tonnes, and 82 tonnes for the half, toward a 700-tonne target.
- China: The People’s Bank of China added 33 tonnes, its largest quarter since Q4 2023, taking reported holdings to 2,346 tonnes.
- Other names: Uzbekistan added 16 tonnes, Kazakhstan 15, Jordan 6 and the Czech Republic 6, with smaller buys from Ghana, Singapore, the UAE and Kyrgyzstan.
- The survey: 89% of reserve managers expected global gold reserves to rise over the next year, and a record 45% expected to raise their own holdings.
Private investment was less loyal. Total gold demand, including OTC, was flat at 1,269 tonnes in Q2, taking the first half to 2,522 tonnes, up 2%, at a record $380 billion. Gold-backed ETFs saw 45 tonnes of outflows in the quarter. High prices kept hurting shops: jewellery demand fell 17 percent year on year as buyers shifted to lighter pieces. Official demand can cushion a rates shock. It did not stop Monday’s screen.
Support Gives Way Under the 100-Day Average
The morning technical map was already bearish before the $4,184.33 print. XAU/USD was holding below the 100-day simple moving average near $4,300 and below the Bollinger middle band around $4,340, with the upper band at $4,462 as a distant cap. The Relative Strength Index was 39.9, soft momentum rather than a washed-out reading. Immediate support was the lower Bollinger band near $4,218.
Monday’s low went through that floor by $33.67. A break that holds opens a deeper pullback while price remains under the moving-average cluster overhead. Anindya Banerjee, head of FICC research at Kotak Neo, had written on September 16 that a close below $4,200 would neutralise the bullish view he was defending through the hike. The metal spent the following days in a $4,230 to $4,510 September range, then lost the round number at the start of the new week.
Jobs Data Will Reset the October Odds
Traders now wait on the Fed’s preferred inflation gauge and the September jobs report, the two prints that can move October more than 70% odds in either direction. A hot pair would keep oil’s inflation impulse alive in the rates market. A soft pair would give gold the dollar-and-yield easing OCBC said it needs to stabilise. The next CPI release is also on the calendar before the October 27-28 meeting.
None of that restores the old haven script on its own. As long as Hormuz keeps crude elevated and Fed officials talk as if September was the start of a cycle, gold is trading as a rates asset that happens to be a war hedge, and the rates side is winning the tape.
The $4,218 band cited as support at the open did not survive the first session of the week. Until oil or the dollar gives that bid back, the metal is working off $4,184.33 with the 100-day average still overhead near $4,300.
Disclaimer: This article is news reporting and market analysis for information only. It is not investment advice, a solicitation to buy or sell gold, silver, oil, Treasuries or any other instrument, and it is not a forecast you should trade. Speak with a licensed financial adviser or broker who knows your aims and risk limits before you act on any price, yield or policy outlook mentioned here. Figures and policy odds reflect the cited data providers and officials as of September 28, 2026, and live markets, Fed communications and oil flows can change them without notice.

Edinburgh Opens a 2027 Tour Built for Time Trials

Korda Maps Auður From Meðalland to Irvine Bay

Apple Music Films Its New Logo in Mineral Oil

Oppo Prices the Pad Mini Above India’s iPad Mini

Austen Soaks Scotland Before Boelo Brings Weekend Gales

Volkswagen Sells the Osnabruck Plant to Clear a Board Fight

Apple’s Foldable iPhone Hinges on Samsung Display Supply

Saksham Gaur Finds He Is His Own Company’s Client

Tata Motors’ Iveco Tender Opens as Holders Still Decide

Onimusha Way of the Sword Preload Hits a Windows 11 Wall
-
 AUTO2 months ago
Volkswagen Sells the Osnabruck Plant to Clear a Board Fight
-
 NEWS2 months ago
Apple’s Foldable iPhone Hinges on Samsung Display Supply
-
 AUTO2 months ago
Tata Motors’ Iveco Tender Opens as Holders Still Decide
-
 BUSINESS2 months ago
Saksham Gaur Finds He Is His Own Company’s Client
-
 GAMING2 months ago
Onimusha Way of the Sword Preload Hits a Windows 11 Wall
-

 ENTERTAINMENT3 years ago
What is SD on Amazon Prime? – All You Need to Know
-

 BUSINESS2 months ago
Hyderabad 22-Carat Gold Jumps After a False Bargain
-

 NEWS2 months ago
iQOO 16 Locks 8,400 mAh While 100W Charging Holds