
BUSINESS
India’s Core BRICS Export Surge Still Runs Through China
India’s exports to core BRICS hit $19.9 billion in April-August, but China took nearly half and a $55.89 billion deficit still defines the account.

India sold $19.9 billion of goods to China, South Africa, Brazil and Russia in April-August, 34% more than a year earlier. A Commerce Ministry official said the four founding BRICS partners are becoming a pillar of the country’s export plan. China took $9.6 billion of the haul, up 39%.
The same five months left a $55.89 billion goods gap with China. The United States still bought more than twice the four-country total.
China Took Almost Half of the Core BRICS Haul
Commerce Ministry figures put combined shipments to the four at $19.9 billion, up from $14.9 billion in April-August 2025-26, a 34% rise. Their share of India’s goods exports moved to 9.2% from 8.1%. China accounted for 48% of that core total.
South Africa was the speed case, not the size case. Shipments there jumped 58% to $4.82 billion. Brazil rose 13% to $3.46 billion. Russia rose 11% to $2.04 billion. Together those two markets still sold less than South Africa alone.
“As India deepens its engagement with the BRICS bloc, strongest momentum is coming from the BRICS members, especially Core BRICS founding partners,” the official said. The line treats the club as the story. The invoice is narrower. China plus South Africa made up $14.42 billion of the $19.9 billion.
Goods exports overall reached merchandise exports of $215.91 billion in the five months, up 17.85% from $183.21 billion, according to the ministry’s 15 September release. Core BRICS grew faster than that headline. It did not outgrow every other market, and it did not balance the China account.
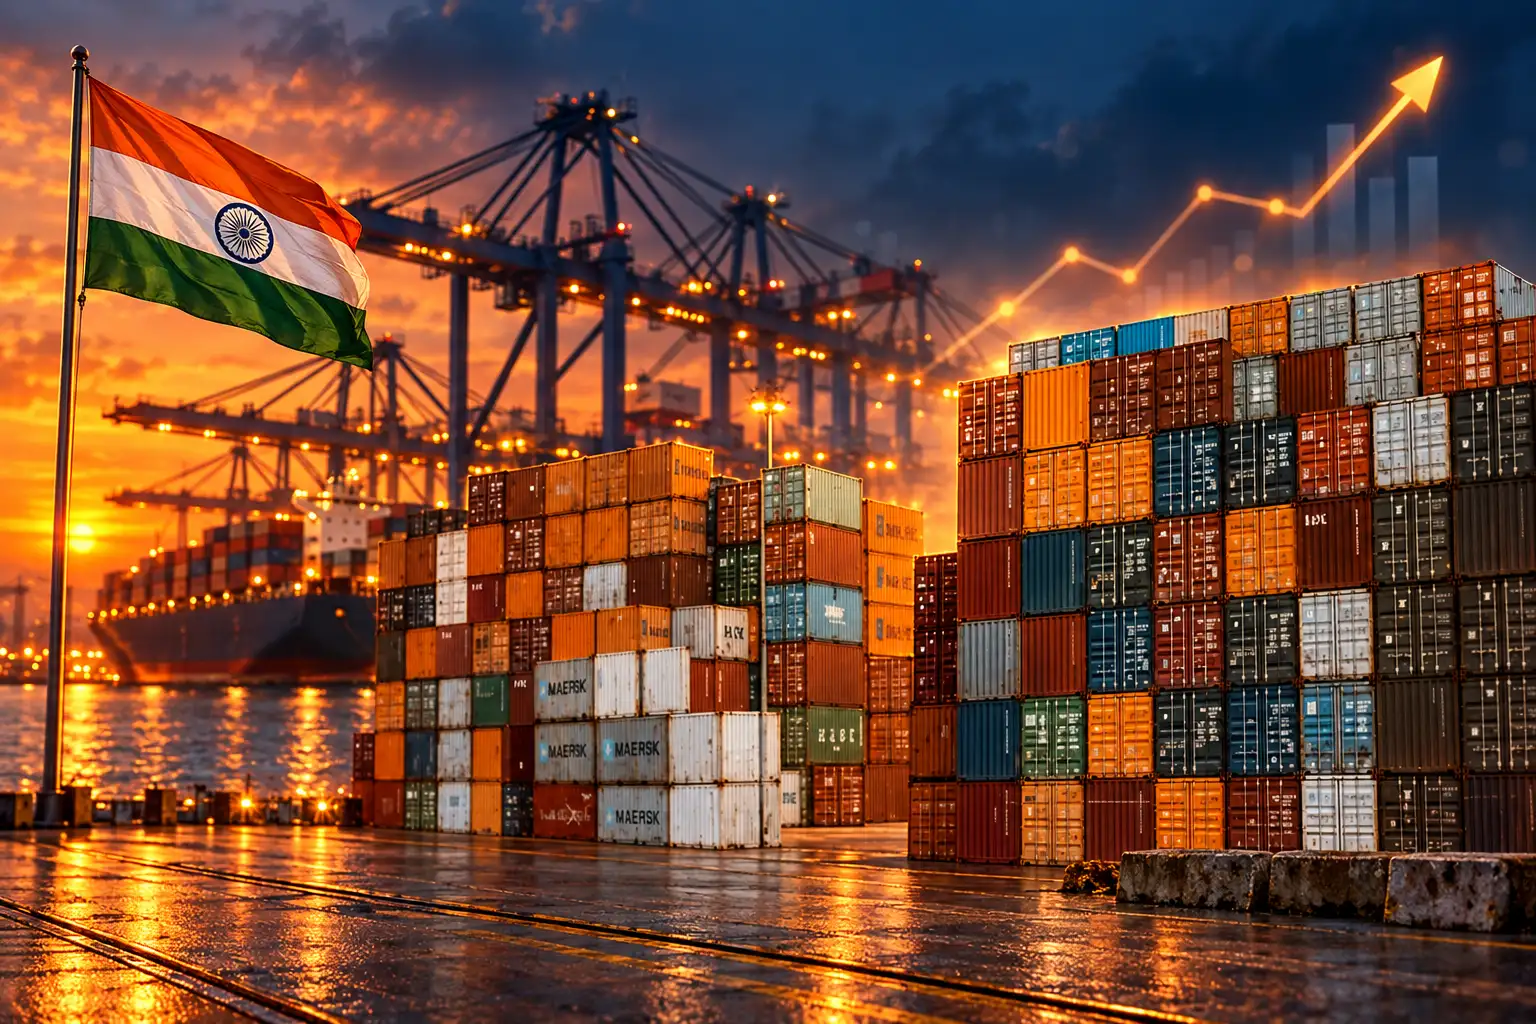
A $55.89 Billion Hole in the China Account
India imported $65.49 billion of Chinese goods in April-August, up 27% from $51.56 billion a year earlier. China was the largest import source. Against $9.6 billion of Indian sales, that is about $6.82 bought for every $1 sold, a gap of $55.89 billion in five months.
THE CHINA IMPORT SIDE
- The five-month bill: Imports from China reached $65.49 billion, up 27% from $51.56 billion.
- The last full year: India took $131.6 billion of Chinese goods in the year ended March, about 17% of all goods imports.
- The electronics hole: A Koan Advisory and Institute of Chinese Studies study put the HS Chapter 85 deficit with China at $43.1 billion in FY26, up from about $20 billion in FY19.
- The lock-in: China supplied 80% or more of India’s imports in 636 tariff lines in FY26, up from 461 lines in FY19.
That is why a 39% export jump does not read as a rebalancing. The export rise comes off a small base. China still took only about 4.4% of Indian goods exports in the year ended March, while the United States took almost a fifth. In August, Indian sales to China did climb 52.35% to $1.9 billion, and imports from China were $12.77 billion the same month.
Ajay Srivastava, a former Indian trade official, put the wider pattern in blunt arithmetic after the 15 September data. Electronics exports rose about $7.6 billion in the five months, he wrote, while electronics imports rose about $20.2 billion. Petroleum product exports rose about $10 billion, while crude and petroleum imports rose about $17.6 billion. The country is selling more, and it is buying still more of the inputs that make those sales.
South Africa Set the Pace as Russia Trailed
The ministry’s core-BRICS briefing breaks the $19.9 billion into four very different books. South Africa is the one that looks like a new market opening. Russia looks like a one-way energy pipe with a thin export trickle on the return leg.
CORE BRICS GOODS SALES, APRIL-AUGUST
| Market | Exports ($ billion) | Growth |
|---|---|---|
| China | 9.6 | 39% |
| South Africa | 4.82 | 58% |
| Brazil | 3.46 | 13% |
| Russia | 2.04 | 11% |
| Four-country total | 19.9 | 34% |
Russia bought $41.44 billion of Indian imports in the same months, up 56.69% from $26.45 billion, led by oil, fertiliser and vegetable oils. India sold it $2.04 billion. External Affairs Minister S. Jaishankar raised that imbalance in talks in Moscow and asked for more room for Indian goods. Discounted crude helps the import bill. It does not turn Russia into an export engine.
Brazil is the quiet middle. Sales of $3.46 billion grew at a steady 13%, in line with many non-BRICS industrial markets and far below the China and South Africa rates. The four-country story is two sprinters and two grinders, not a bloc moving as one.
Little Extra From the New BRICS Intake
Commerce Secretary Rajesh Agrawal said exports to BRICS as a whole grew 13.3% to $34.5 billion in the first five months. Subtract the $19.9 billion core four and the six newer members account for about $14.6 billion. The United Arab Emirates alone took $13.59 billion, which leaves roughly $1 billion for Saudi Arabia, Indonesia, Egypt, Ethiopia and Iran together on this print.
The official line was that core BRICS grew “nearly three times faster” than the broader grouping. The 34% versus 13.3% split is the math behind that phrase. It also means the 2024-25 expansion has not, on these figures, become an export engine.
THE BRICS INTAKE SINCE 2024
- 2024: Egypt, Ethiopia, Iran, the United Arab Emirates and Saudi Arabia join the original five.
- 2025: Indonesia joins, taking the full members to 11.
- Last year: Belarus, Bolivia, Kazakhstan, Cuba, Malaysia, Nigeria, Thailand, Uganda, Uzbekistan and Vietnam become partner countries.
August already showed how thin that extra slice can get. Sales to the UAE fell 26.1% that month to $2.4 billion, which the ministry tied to the West Asia crisis. Saudi shipments also fell in August. The 18th BRICS Summit in New Delhi in mid-September put trade facilitation, customs work, digital services and a Global Value Chains Action Plan for 2026-30 on the table. The five-month ledger still says the money is in China, South Africa and the UAE, not in the rest of the new intake.
Why Japan and America Still Matter More
Japan took $3.43 billion of Indian goods in April-August, up 43%, a faster rise than the 39% gain to China. The United States still bought $42.79 billion, more than twice the core BRICS total, even after growth slowed to 6.17% and Washington added a 10% duty on much of the basket from 24 July.
That US figure is up from $40.31 billion a year earlier. It is still the paycheck. Singapore, which is not a BRICS member, jumped 96.56% to $9.50 billion and almost matched China. The Netherlands took $6.95 billion. Germany took $5.33 billion. The European Union as a bloc rose 3.84% to $27.78 billion, a slower climb than core BRICS and still a larger cheque than the four founding partners combined.
Washington’s tariff overlay is the reason the 6.17% US print looks soft next to China and Japan. A temporary 10% global surcharge ran into late July. On 24 July the USTR replaced it with a 10% Section 301 duty on Indian goods, cut from a 12.5% proposal after talks with New Delhi. The Commerce Ministry said about 45% of US-bound shipments, including many phones, medicines and energy products, stay outside that extra 10%. Steel, aluminium and auto parts remain under separate Section 232 rates. On 18 September President Donald Trump signed a law that lets him put tariffs of up to 100% on countries that buy Russian oil, including India. It is authority, not a new duty yet.
August itself was kinder to the US book. Sales there rose 21.83% to $8.4 billion, even with the extra duty in force. The five-month rate is the one that shows the drag.
Shipments to Italy and South Korea
Italy took $3.92 billion, up 29.9% from $3.02 billion. South Korea took $3.21 billion, up 22% from $2.63 billion. The ministry said the Korea book is being pulled by minerals, fuels, electronics, aluminium, iron and steel and chemicals, the same industrial-input mix that is showing up in Japan.
Japan’s rise was led by mineral fuels, which added $231.7 million, a 76% increase, with electronics and aluminium also up. Those are the same categories officials cited for Korea. The geography is different. The goods are not. India is selling more energy, metal and middle-stage inputs into several industrial systems at once, BRICS and otherwise.
Phone Parts Leave as Circuit Boards Arrive
The China export jump is no longer only ore and oil. Electronics and engineering are now among the main drivers, according to an analysis of the government data, with industry officials pointing to AI servers and data-centre build-outs. Electronics sales to China rose more than 15% in April-August. Engineering sales to China rose about 21%, including machinery, auto parts and hand tools.
Telephone parts under HS 851779, a line that includes transmission gear and, in last year’s mix, printed circuit boards, reached $1.003 billion in April-July, up 275.99% from $266 million. In FY26 that single line was $2.32 billion, up 498% from $389 million. Electronics shipments to China tripled to $3.18 billion in the year ended March, including board assemblies, phones, display modules and telecom equipment. A May customs snapshot still showed petroleum, iron ore and telecom gear as the top Indian lines into China that month.
The surge in exports to China is partly driven by pressure on suppliers to meet the demand for high-end equipment required for AI-related products and as data centers proliferate. This has encouraged exports of electronics from India to China.
Rajoo Goel, secretary general, Electronic Industries Association of India
Pankaj Mohindroo, chairman of the Indian Cellular and Electronics Association, said the rise shows Indian factories winning some credibility in a hard value chain. He also said the next job is to move from parts into sub-assemblies and finished goods, and to deepen design at home. Chinese customs, executives note, do not show a matching jump in printed circuit boards from India; much of the rise lands under phones and other telecom products, a classification mismatch that makes the exact mix harder to pin down.
The inbound book is still the heavier one. India’s electronics imports rose 43.57% to $66.47 billion in April-August, from about $46.3 billion. Integrated-circuit imports from China were up 72.25% in April-July, with a $5.085 billion deficit on that line alone. Koan and the Institute of Chinese Studies found that five HS 85 buckets, including phones, chips, batteries, semiconductor devices and display modules, accounted for a $28.8 billion deficit with China in FY26. Across all goods, the ministry’s quick estimates put engineering goods at $58.70 billion of exports in the five months, petroleum products at $35.31 billion, and electronic goods at $26.66 billion, up 39.7%.
Lines that hire a lot of people did not join the party. Ready-made garments fell 9.1% in April-August. Leather products fell 4.3%. Tea fell 15.5%. Spices fell 7.4%. The export boom is in oil products, electronics and engineering. It is not in the factories and farms that absorb the most labour.
Indian officials can fairly say core BRICS is growing faster than the country’s goods trade as a whole. They cannot say the club has replaced the United States, or that a 39% rise in sales to China has closed a $55.89 billion hole. The five-month print leaves that hole in place: $9.6 billion sold, $65.49 billion bought.

Edinburgh Opens a 2027 Tour Built for Time Trials

Korda Maps Auður From Meðalland to Irvine Bay

Apple Music Films Its New Logo in Mineral Oil

Oppo Prices the Pad Mini Above India’s iPad Mini

Austen Soaks Scotland Before Boelo Brings Weekend Gales

Volkswagen Sells the Osnabruck Plant to Clear a Board Fight

Apple’s Foldable iPhone Hinges on Samsung Display Supply

Saksham Gaur Finds He Is His Own Company’s Client

Tata Motors’ Iveco Tender Opens as Holders Still Decide

Onimusha Way of the Sword Preload Hits a Windows 11 Wall
-
 AUTO2 months ago
Volkswagen Sells the Osnabruck Plant to Clear a Board Fight
-
 NEWS2 months ago
Apple’s Foldable iPhone Hinges on Samsung Display Supply
-
 AUTO2 months ago
Tata Motors’ Iveco Tender Opens as Holders Still Decide
-
 BUSINESS2 months ago
Saksham Gaur Finds He Is His Own Company’s Client
-
 GAMING2 months ago
Onimusha Way of the Sword Preload Hits a Windows 11 Wall
-

 ENTERTAINMENT3 years ago
What is SD on Amazon Prime? – All You Need to Know
-

 BUSINESS2 months ago
Hyderabad 22-Carat Gold Jumps After a False Bargain
-

 NEWS2 months ago
iQOO 16 Locks 8,400 mAh While 100W Charging Holds