
 Ishan Crawford
 England’s water companies paid their chief executives and finance directors a combined £25.3m last year while sewage continued to hit rivers and beaches and Thames Water edged toward insolvency. Across the border, publicly owned Scottish Water reinvested every surplus, charged households less and recorded its strongest performance year. The gap is not an accident of geography. It is the living result of a single choice made in 1989.
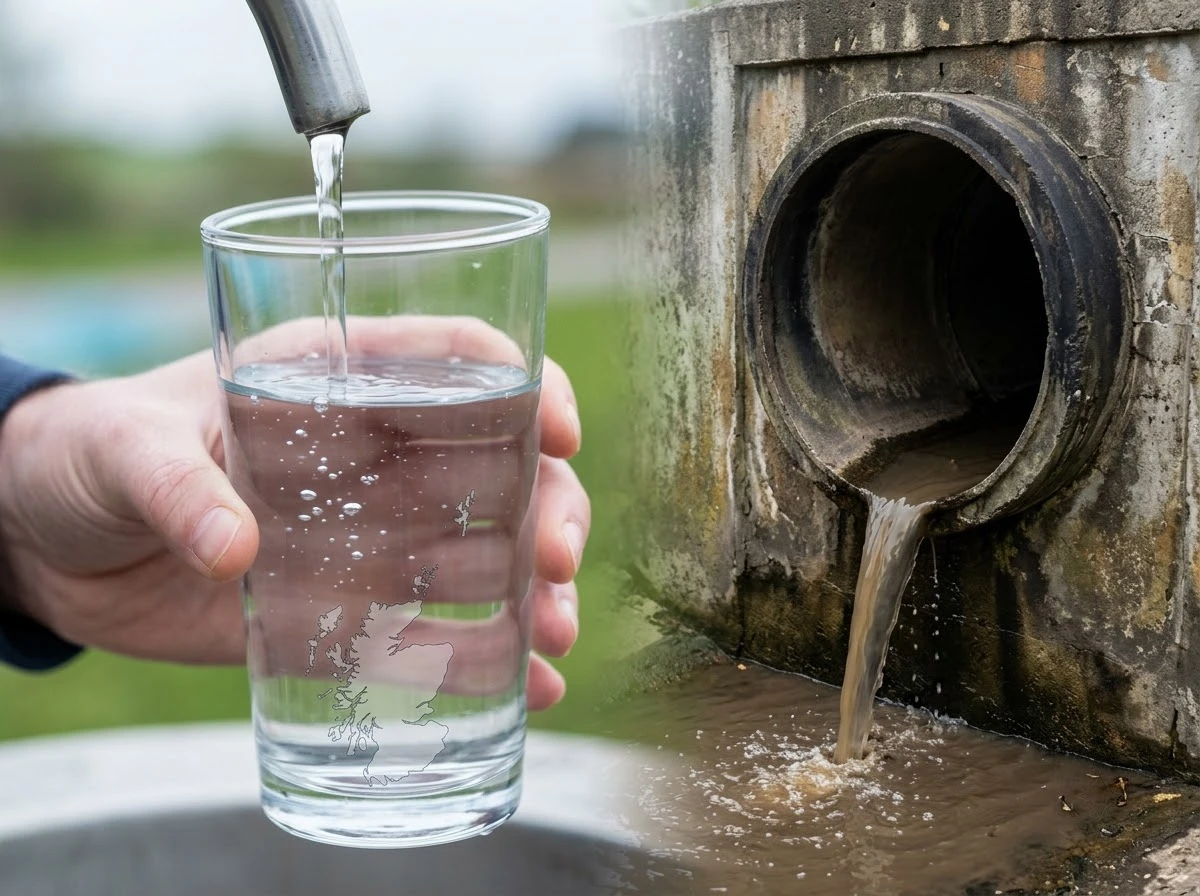
Scotland refused privatisation. England embraced it. The counterfactual is no longer theoretical: the numbers show what the other path delivered and what England still carries.
The 1989 Fork England Took Alone
Margaret Thatcher’s government sold the ten regional water authorities in England and Wales for £7.6bn in 1989. The state wrote off roughly £5bn of existing debt and added a “green dowry” of public cash to sweeten the deal. Shares floated; private owners took control of a natural monopoly.
Scotland faced the same pressure. After public consultation the proposal was rejected. Three public water authorities continued until 2002, when they merged into a single publicly owned company, Scottish Water. No shareholders. No dividends. Surpluses stay inside the system.
England and Wales became the only fully privatised national water and sewerage system in the world. That structure still governs the industry today.
- 1989: England and Wales sell ten regional water authorities for £7.6bn, with roughly £5bn of debt written off and a public green dowry attached.
- 1989 to 2002: Scotland keeps three public water authorities after consultation rejects the sale.
- 2002: The three Scottish authorities merge into one publicly owned company, Scottish Water, with surpluses retained in full.
- 1991 to 2019: English private companies distribute £57bn in dividends while customer bills fund nearly all capital works.
- After 2009: Scottish Water debt falls; English company debt rises sharply on the same essential service.
The fork was administrative, not geological. Same island, same Victorian pipe inheritance, same need to treat waste and deliver drinking water. Ownership alone set the two systems on different tracks, and those tracks have not converged.
What the Public Path Produced
From 2002 onward the performance difference became measurable. Research from the Public Services International Research Unit at the University of Greenwich found Scottish Water invested nearly 35% more per household since 2002 than the English companies, averaging £282 against £210 a year. Had the English firms matched that rate, an extra £28bn would have gone into pipes, treatment works and networks.
Bills tell the same story. Scottish households paid about 14% less on average. Debt at Scottish Water fell after 2009. No dividends left the company. English companies, by contrast, distributed £57bn to shareholders between 1991 and 2019, roughly £2bn a year, much of it to foreign parent groups.
| Metric | Scottish Water (public) | England companies (private) |
|---|---|---|
| Capex per household (2002 onward) | £282 average | £210 average |
| Relative charges | 14% lower | Baseline |
| Dividends 1991-2019 | £0 | £57bn |
| Debt trajectory post-2009 | Reduced | Rose sharply |
Recent years reinforce the pattern. Scottish Water reported record investment of £1.09 billion in one recent year and another strong outturn near £1.13bn, with customer satisfaction at record highs and serious pollution incidents at their lowest. Its CEO package sits in the low-to-mid £400,000s. English totals for top executives alone reached £25.3m.
The investment gap compounds. Each year of higher capex per household in Scotland adds capacity that England did not buy. Over a generation that becomes the £28bn shortfall already identified: treatment works not upgraded, combined sewers not relieved, leakage not cut at the same pace. Lower average bills did not starve the public company of capital. They accompanied higher investment because surplus never left the balance sheet as dividends.
England’s Extractive Balance Sheet
Privatisation was sold as a route to private capital and efficiency. The capital mostly never arrived as new equity. Customers funded almost all investment through bills. Companies borrowed heavily and used the cash to support dividend payments. By 2019 shareholder equity on the regulated books sat below the original 1991 injection in real terms.
The result is visible on every balance sheet. Thames Water carries a debt pile near £20bn and has spent months negotiating with creditors and government over special administration or a rescue that keeps it private. Other firms face Ofwat’s performance-related pay prohibition after pollution failures. Six companies triggered the rule in the latest assessment for category-1 incidents, credit-rating breaches or one-star environmental ratings.
Executives still found ways to raise total pay. Anglian Water’s Mark Thurston received a package around £1.86m including a £500,000 retention payment. United Utilities’ Louise Beardmore reached £2.5m. Wessex Water lifted its CEO base salary 14% even under a bonus ban. Severn Trent’s Liv Garfield previously took home multi-million packages in years of rising spill hours.
- £25.3m combined CEO and CFO pay across 14 companies in the latest year
- £57bn dividends extracted 1991-2019
- Thames Water debt approaching £20bn
- Scottish Water CEO total near £430k-500k range with full reinvestment
Ofwat’s own performance-related executive pay assessment confirms the prohibition mechanism blocked more than £4m in potential bonuses at the worst performers, yet base salaries and group-level payments kept climbing.
The pattern is mechanical. Bill revenue and new borrowing enter the company. A slice leaves as dividends and executive packages. What remains must cover maintenance, upgrades and interest on a rising debt stock. When spills and one-star ratings arrive, the regulator can freeze bonuses, yet the underlying flow toward shareholders and top pay continues through base salary and retention awards. Thames Water’s near £20bn debt load is the extreme case of the same design, not a one-off accident.
Sewage, Health and the Missing Incentive
Raw sewage discharges remain routine. Environment Agency data has recorded hundreds of thousands of spill events and millions of hours of overflow in recent years. Anglian Water alone posted more than 1,000 incidents in successive years and drew a £63m Ofwat fine. Wessex released the equivalent of years of continuous spillage in one reporting period.
England’s chief medical officer, Chris Whitty, has repeatedly flagged the public-health risk. In a joint statement he described sewage in water a growing public health problem, noting both storm overflows and continuous treated discharges that still carry pathogens. Swimmers and river users fall ill. The same incentive structure that rewards dividends also tolerates under-maintenance of the combined sewer network that Victorian engineers left behind.
Scottish Water is not perfect. It faces climate pressure, leakage challenges and its own bill rises. Yet its serious pollution numbers have fallen and its drinking-water compliance stays near 99.9%. Because every pound stays inside the business, the trade-off between shareholder return and asset health does not exist.
Clean water isn’t a luxury: it’s necessary to human health and wellbeing.
Devi Sridhar, chair of global public health, University of Edinburgh, The Guardian
Fines arrive after the fact. Anglian’s £63m penalty and Ofwat’s bonus blocks respond to failures already logged in spill hours and category-1 incidents. They do not rebuild the incentive to prefer network health over extraction. In a public company the surplus has nowhere else to go. In the privatised model, every pound retained for pipes is a pound not paid to shareholders, so under-maintenance is rational until the regulator or the beaches force a reckoning.
Bills Rise While Choice Stays Zero
Households cannot switch supplier. Water is a regional monopoly by design. Privatisation never created the competition that works for cars or pharmaceuticals. Customers simply pay the regulated bill, which has climbed while infrastructure lagged.
In Scotland the charge arrives through council tax. Free public drinking-water stations under the Your Water Your Life campaign have dispensed the equivalent of millions of plastic bottles since 2018. The company remains accountable to the Scottish government and, ultimately, to the people who use the taps.
English customers fund both the network and the returns that leave the country. Foreign ownership of several parent groups means the profits do not recycle into the UK tax base or local jobs at the same rate.
Without exit rights, the only discipline left is regulatory. Ofwat can cap bills, ban bonuses and levy fines, yet it cannot invent a rival pipe network. The customer still pays for debt service, dividends already taken, and the catch-up investment that earlier extraction deferred. Scotland’s council-tax collection route and government borrowing access do not create consumer choice either, but they do keep surplus and accountability inside a single public frame rather than splitting them between bill-payers and offshore parents.
How Ownership Steers Capital And Risk
The two models move money in opposite directions once revenue lands. Under public ownership, surplus funds capital works or reduces debt. Under the privatised structure, surplus is available for dividends first, with investment resting on bills and new borrowing. That is why Scottish Water could post record outlays near £1.09bn and £1.13bn while holding CEO pay in the low-to-mid £400,000s, and why English firms could return £57bn to shareholders across three decades while still loading balance sheets with debt.
- Public path: bills and government-rate borrowing enter; surplus stays; debt can fall as assets improve.
- Private path: bills and market borrowing enter; dividends and high executive pay exit; debt rises to sustain both investment and extraction.
- Shared constraint: regional monopoly means neither system faces customer switching, so ownership rules set the real incentives.
Risk follows the same split. When English companies under-invest, spills, fines and credit-rating pressure land on the operating company and, ultimately, on customers and taxpayers if a rescue looms. Thames Water’s talks over special administration or a private rescue show how far that risk can travel. Scottish Water’s lower per-capita debt growth and retained surplus keep more of the risk inside a system already answerable to government, without a parallel claim from shareholders seeking returns.
Executive pay tracks the same logic. A combined £25.3m for English CEOs and finance directors sits far above the Scottish chief executive range near £430k to £500k. Retention payments and base-salary rises under bonus bans show how private groups still move cash to the top even when Ofwat blocks more than £4m in performance awards. The public model has no equivalent outlet.
Why The Dividend Gap Keeps Widening
Compound effects now dominate the comparison. The £282 versus £210 annual capex gap per household looked moderate year by year. Multiplied across England’s customer base since 2002 it becomes the £28bn not spent on networks. Dividends of roughly £2bn a year built the £57bn total by 2019. Each pound paid out was a pound not available to cut leakage, expand storage or ease storm overflows.
English equity on regulated books falling below the real value of the 1991 injection captures the long arc. Owners took value out faster than they put new equity in. Customers and lenders filled the hole. Scotland’s zero-dividend rule produced the mirror image: no extraction total, falling debt after 2009, and investment rates that outpaced the private peer group by about 35% per household.
| Pressure point | Public response (Scotland) | Private response (England) |
|---|---|---|
| Surplus after costs | Reinvested or used to cut debt | Available for dividends and top pay |
| Investment funding | Bills plus government-rate borrowing | Bills plus heavier market debt |
| Pollution and pay | Serious incidents at record lows; CEO pay capped by public norms | Bonus bans and fines after spills; base and retention pay still climb |
| End-state example | £8.1bn capex planned inside a £13.4bn envelope for 2027-33 | Thames Water near £20bn debt and rescue talks |
None of these outcomes required different rainfall or different rivers. They followed from who held title to the assets and who had a claim on the residual cash. The widening gap is what a decades-long extraction cycle looks like when set beside a decades-long reinvestment cycle.
The Path Still Open North of the Border
Scottish Water’s latest business plan for 2027-33 proposes £8.1bn of capital investment inside a £13.4bn total funding envelope, with bill rises moderated below earlier drafts. It continues to borrow from the Scottish government at rates unavailable to private peers and keeps debt growth far lower per capita.
The model is not radical. Most of the world’s water systems remain public. England’s full privatisation stands as the outlier. Prem Sikka and other long-term critics on X have kept the arithmetic circulating for years: tens of billions extracted, reservoirs unbuilt, leaks measured in hundreds of millions of litres a day, and still the claim that private ownership alone can deliver the capital.
That claim has now run into Thames Water’s balance sheet, Ofwat’s bonus bans and beaches closed after spills. The counterfactual is no longer an academic exercise. It is the working system operating 400 miles north, delivering more investment per house, lower average bills and zero dividends while England’s private companies ask government for backing.
The 1989 decision locked England into an ownership form that rewards extraction. Scotland’s refusal locked it into reinvestment. The numbers that followed were never mysterious. They were the predictable consequence of who owns the pipes and who gets the surplus.
 Scotland’s Facial Recognition Push Sparks Mask Ban Call
  Galaxy Z Flip 8 Hits $799 Only If Your Trade-In Qualifies
  Samsung Smart Switch Now Moves Passwords and eSIM From iPhone
  Old Firm Spend Pulls Clear as Premiership Rivals Patch Squads
  Chinese Studios Quietly Seize the Gamescom Stage
  Vivo V80 Lite 5G Hits Pakistan With Curved Screen and Split Identity