
 Ishan Crawford
 India’s industrial output grew 4.9% in April 2026, beating the 3.9% that economists polled by Reuters had pencilled in, in the first reading drawn from a rebuilt Index of Industrial Production (IIP, the monthly gauge of mining, manufacturing and power output). Growth came in below the 5.7% recorded a year earlier, but well above the revised 3.2% logged in March.
That print travelled fast across trading desks and policy notes. The change sitting beneath it will last longer: April marked the debut of the 10th base-year revision in the index’s history, an overhaul that resets what India counts as factory work and how every future month gets measured.
April’s Print Cleared the Forecast Bar
The April number landed nearly a full percentage point above consensus, a beat that industry groups were quick to welcome. It was also a clear pickup from March, which the new series now pegs at 3.2%, down from the 4.1% the old series had shown. February went the other way, revised up to 5.3% from 5.1%.
For context, this was only the second full month of data since fighting erupted in West Asia at the end of February, a shock that hit energy supply for a country that buys nearly all the crude it burns. Against that backdrop, a sub-5% reading that still topped forecasts counted as a steady result rather than a soft one. The headline figure comes from the official Index of Industrial Production release compiled by the statistics ministry.
- 4.9% headline IIP growth in April, the first month under the new base
- 3.9% the consensus forecast from economists polled by Reuters
- 5.7% the year-earlier April reading on the old series
- 3.2% the revised March figure, down from 4.1% before the overhaul
Why the Base Year Moved to 2022-23
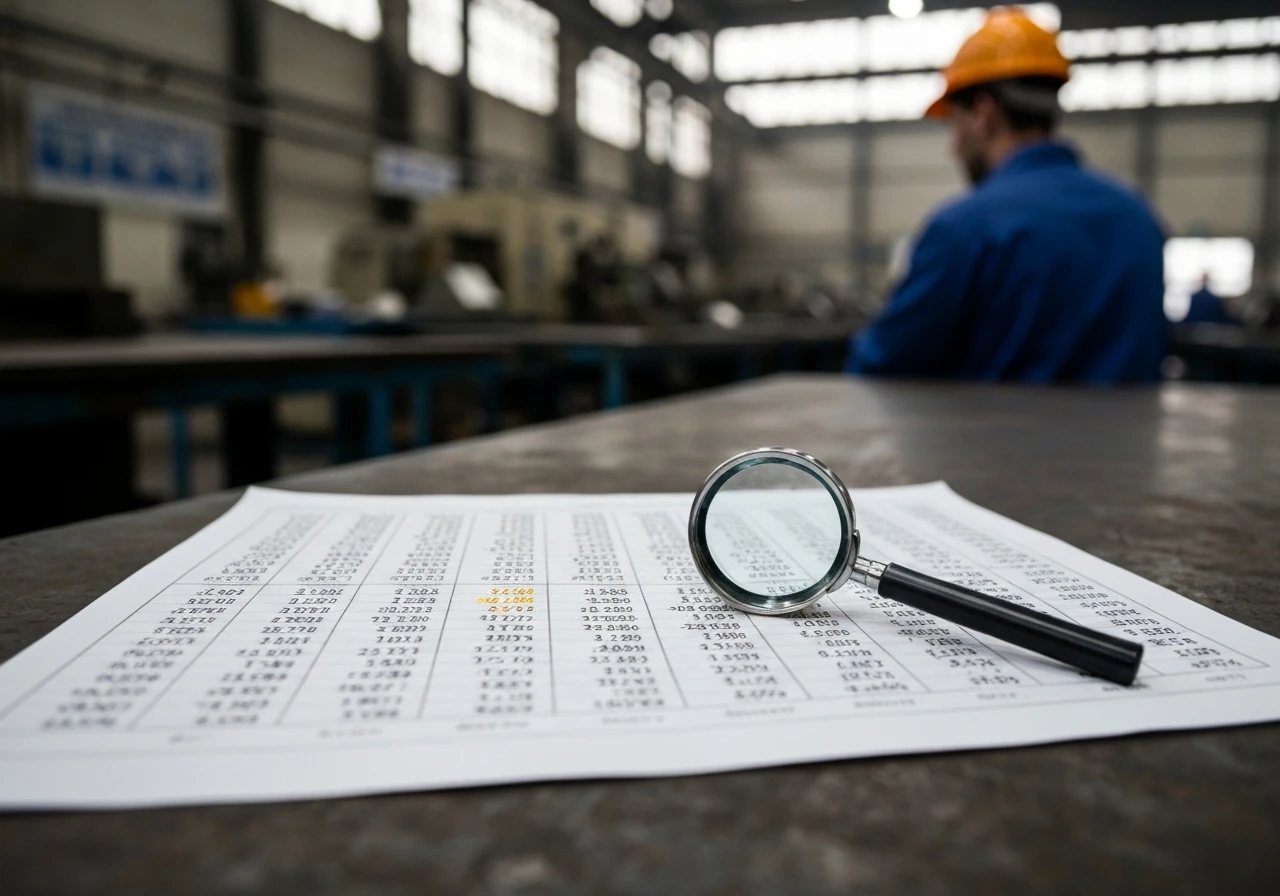
The base year is the benchmark against which output is measured, and India’s had been frozen at 2011-12 for more than a decade. By 2026 that reference point described an economy that no longer existed. A technical advisory committee (TAC, the expert panel set up to review the index) submitted its report on May 25, 2026, clearing the way for the switch.
This is the 10th time the base has been reset since the series began, and the first to line up with the National Industrial Classification (NIC-2025, the updated coding system India uses to sort industries). The shift lets the index fold in activity that simply was not significant fifteen years ago, and drop products that have all but vanished from factory floors.
The Ministry of Statistics and Programme Implementation (MoSPI), which compiles the data, describes the revision as a way to make the gauge more representative of current output. The committee’s work, set out in the ministry’s base-year revision notes, also opens the door to swapping out factories that have permanently closed for comparable operating units, and adding newly commissioned large plants to the sample.
What Entered the Basket and What Got Dropped
The new series tracks 1,042 products across 463 item groups, up from 407 groups before, with 120 new groups added and 64 retired. The reshuffle is the most visible piece of the overhaul, and the clearest sign of how India’s production map has shifted.
The additions read like a tour of newer industries. Rare earth and minor minerals widen the mining component. Gas supply, water supply, sewerage and waste treatment push the index beyond its traditional three sectors.
Among manufactured goods, the list now includes aircraft and spacecraft parts, medical stents, human vaccines, CCTV cameras, magnetic stripe cards such as debit and credit cards, and non-woven textiles. The detail behind the rebuild was aired in the pre-release consultation on the base revision held late last year.
The retirements tell the inverse story. Kerosene, compact fluorescent lamps and fluorescent tubes, and tubes for bicycle, tricycle and rickshaw tyres all left the basket, products whose share of output has shrunk as habits and technology moved on.
| Added to the new series | Retired from the old series |
|---|---|
| Rare earth and minor minerals | Kerosene |
| Gas, water and waste treatment | Compact fluorescent lamps |
| Aircraft parts, stents, vaccines | Fluorescent lighting tubes |
| CCTV cameras, magnetic stripe cards | Bicycle and rickshaw tyre tubes |
Manufacturing Led While Mining Fell Behind
Under the rebuilt index, manufacturing remains the heavyweight, carrying more than three-quarters of the total weight. It grew 6.2% in April, a four-month high, and did most of the heavy lifting for the headline.
| Segment | Classification | April 2026, year on year |
|---|---|---|
| Manufacturing | Output sector | +6.2% |
| Electricity and gas supply | Output sector | +4.9% |
| Water, sewerage and waste | Output sector | +6.6% |
| Mining and quarrying | Output sector | -5.1% |
| Capital goods | Use-based | +16.0% |
| Intermediate goods | Use-based | +7.7% |
| Infrastructure, construction | Use-based | +7.1% |
| Consumer durables | Use-based | +4.3% |
| Consumer non-durables | Use-based | +2.8% |
| Primary goods | Use-based | +0.8% |
The Sector Split
Output split unevenly across the four broad segments. Manufacturing and electricity-plus-gas supply both expanded, and the newly added water supply, sewerage and waste line rose 6.6%. Mining and quarrying was the drag, the only one of the four sub-segments to contract during the month.
“Manufacturing output, in particular, witnessed a sharp acceleration in growth to a four-month high of 6.2% in the month from 3.9% in the previous month, amidst a double-digit growth in seven of the 23 sub-segments. However, some sub-segments recorded a contraction in the month of April 2026 and the underlying performance was very varied,” said Aditi Nayar, chief economist at ICRA Ltd.
The Use-Based Read
The use-based breakdown, which sorts output by economic purpose, told a more bullish story. Capital goods, a proxy for investment spending, jumped 16%. Intermediate goods rose 7.7%, infrastructure and construction goods 7.1%, consumer durables 4.3% and consumer non-durables 2.8%.
Primary goods were the weak link, edging up just 0.8%. The gap between a 16% jump in investment goods and a near-flat primary reading is the kind of spread the rebuilt index is designed to show more plainly.
The Energy Price Shock Heading for the Run Rate
The brighter read on April came with a warning attached. The conflict that broke out at the end of February disrupted energy flows for India, the world’s third-largest crude oil consumer and a buyer of nearly all the oil it uses. Manufacturing, around 13% of the wider economy, sits directly in the path of any sustained rise in fuel and freight costs, as set out in India’s position in the global oil market.
Industrial production could remain subdued in the months ahead due to weaker global demand and supply chain disruptions. The larger risk, though, is rising costs. The energy supply shock caused by the conflict in West Asia has morphed into a price shock, with the costs of fuel, transport and other imported inputs increasing.
That assessment came from Dipti Deshpande, principal economist at Crisil. Her point is that the threat has shifted from supply gaps to prices, the sort of pressure that squeezes margins before it ever shows up in output volumes.
How the Rebuilt Series Changes the Read
Beyond a single month’s number, the overhaul changes how analysts and policymakers will read industrial data for years. The old series had grown blunt, and the replacement is built to catch shifts the previous basket missed.
- Separate indices for renewable and non-renewable power generation, letting officials track the energy mix month to month.
- The mining and quarrying segment split into fuel, metallic and non-metallic minerals for sharper detail.
- A standing mechanism to replace shuttered factories with comparable operating units and add newly commissioned large plants.
There is a catch for anyone comparing months across the boundary. Because the weights and the basket have both changed, the revised figures for March and February no longer line up cleanly with the old prints, and the year-ago base will keep getting recast as the series beds in.
The next test arrives on June 29, when the May reading lands. If the price shock Crisil flags has begun to bite, the rebuilt index will register it in finer detail than the old one could; if global demand holds and the capital-goods surge carries through, the run rate has something firmer to stand on.
Frequently Asked Questions
What was India’s industrial output growth in April 2026?
India’s IIP rose 4.9% year on year in April 2026, the first reading under the new 2022-23 base year. It beat the 3.9% forecast from economists polled by Reuters but trailed the 5.7% pace recorded in April 2025.
Why did India revise the IIP base year to 2022-23?
The earlier 2011-12 base no longer reflected the structure of the economy. A technical advisory committee submitted its report on May 25, 2026, and the new series aligns with the NIC-2025 classification. It is the 10th base-year revision since the index began.
What new items were added to the IIP basket?
The revised basket covers 1,042 products across 463 item groups, including 120 new groups. Additions include rare earth minerals, gas supply, water and waste treatment, aircraft and spacecraft parts, medical stents, human vaccines, CCTV cameras and magnetic stripe cards.
How did manufacturing and mining perform in April 2026?
Manufacturing grew 6.2%, a four-month high and the main driver of the headline. Mining and quarrying contracted 5.1%, the only one of the four broad segments to shrink during the month.
How could the West Asia conflict affect Indian industrial output?
Crisil warns the conflict has turned from an energy supply shock into a price shock, lifting fuel, transport and import costs. It expects industrial production to stay subdued in the coming months on weaker global demand.
When is the next IIP data release?
MoSPI will release the May 2026 IIP data on June 29, 2026, the second full reading under the rebuilt series.
 ONGC licence frees Venezuela cash and operatorship talks
  Anthropic Hits $65 Billion Run Rate and Flips the AI Cash Test
  Supreme Court grounds the fare free-for-all with three-week clock
  Gold Nears $4400 as Soft Data Meets Oil Inflation Risk
  Nifty Slips as Zaggle Circuits and Dhoot Debuts Big
  Diesel Crack Tops $100 as Iran Rhetoric Lifts Crude